
Last January, my electricity bill jumped $47 in a single month. Nothing changed in my house — no new appliances, no extra guests, same weather. That mystery sent me down a rabbit hole that turned into a 30-day obsession with phantom load electricity waste. Phantom loads are the watts your devices draw even when you think they’re off. And I’m here to tell you: they are silently bleeding your wallet dry right now.
I’ve been a licensed electrician for 12 years. I’ve wired hundreds of homes and installed solar systems across the Pacific Northwest. But I’ll be honest — I underestimated how much standby power was costing my own household. That humbling realization is exactly why I decided to meter every single outlet in my house, document the results, and share what I found.
Over 30 days, I tracked 47 individual devices. The total annual cost of my phantom loads came out to just over $214. That’s money I was throwing away without a second thought. In this post, I’ll walk you through exactly how I did it, what I found, and how you can slash that number in your own home.
What Is Phantom Load Electricity Waste — And Why It’s Worse Than You Think
Phantom load goes by several names: standby power, vampire power, idle current. Whatever you call it, the concept is the same. Your devices draw electricity even when they’re not actively in use. The International Energy Agency estimates that standby power accounts for roughly 5–10% of residential electricity consumption in developed countries. In the U.S., that translates to about $19 billion wasted annually across all households.
The worst offenders are not always obvious. Everyone suspects the big TV. However, in my 30-day audit, my television only ranked fourth. The real surprises were a gaming console drawing 28 watts in “rest mode,” a cable box pulling a constant 17 watts, and an old laser printer that never fully powers down. That printer alone was costing me $18 a year to do absolutely nothing.
Here’s the technical reason this happens. Most modern electronics use switch-mode power supplies that remain energized to maintain remote control receivers, network connections, and clock functions. Even a device rated at 0.5 watts in standby — which sounds trivial — costs about $0.53 per year. Multiply that across 47 devices, and the numbers compound fast. Understanding this is step one. Measuring it is step two.
How I Set Up My 30-Day Phantom Load Audit
My methodology was straightforward. I moved through every room systematically, plugging each device into a watt meter and recording the standby draw in watts. Then I calculated annual cost using this formula: (watts × hours per day in standby × 365) ÷ 1,000 × local kWh rate. My local rate is $0.127 per kWh, which is close to the U.S. national average of $0.16.
I started in the home office, moved to the living room, then the kitchen, bedrooms, and finally the garage. Each room took about 20–30 minutes to audit properly. I kept a simple spreadsheet with the device name, measured standby watts, estimated daily standby hours, and calculated annual cost. No fancy software required — just consistent data collection.
One thing I learned the hard way: don’t just measure a device once. Some devices cycle through power states. For example, my smart TV would draw 2.1 watts immediately after shutting off, then drop to 0.8 watts after about 90 seconds. Always wait at least two minutes before recording your standby number. That small detail took me an embarrassing amount of time to figure out on day three of the project.
Rooms That Surprised Me Most
The garage was my biggest shock. I had a battery charger, an old chest freezer, a stereo receiver from 2009, and a shop vac plugged in full-time. Combined standby draw: 61 watts. That single room was costing me approximately $68 per year just in idle consumption. The stereo receiver alone pulled 22 watts in standby — more than some actively running LED light fixtures.
The kitchen was the second surprise. The microwave clock draws 3 watts constantly. A countertop coffee maker with a digital display pulls 4 watts when idle. An under-cabinet TV/radio combo I barely use was drawing 11 watts around the clock. Small numbers individually, but together they added up to nearly $20 per year from one kitchen.
The Kill A Watt That Turned My Phantom Load Obsession Into Hard Data
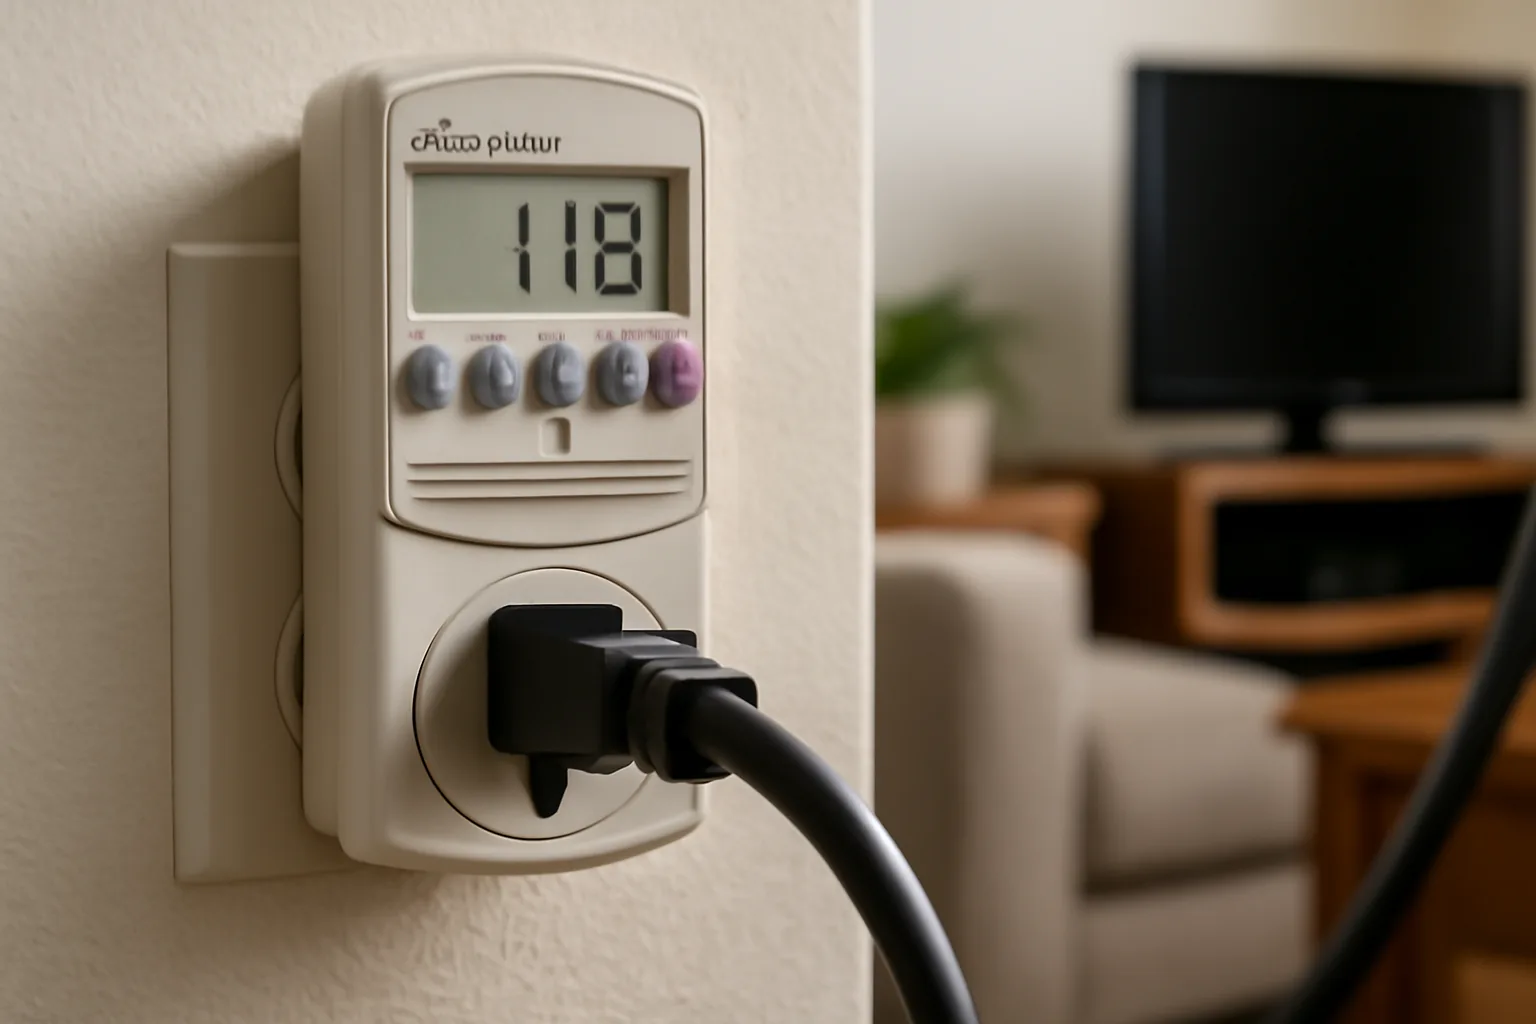
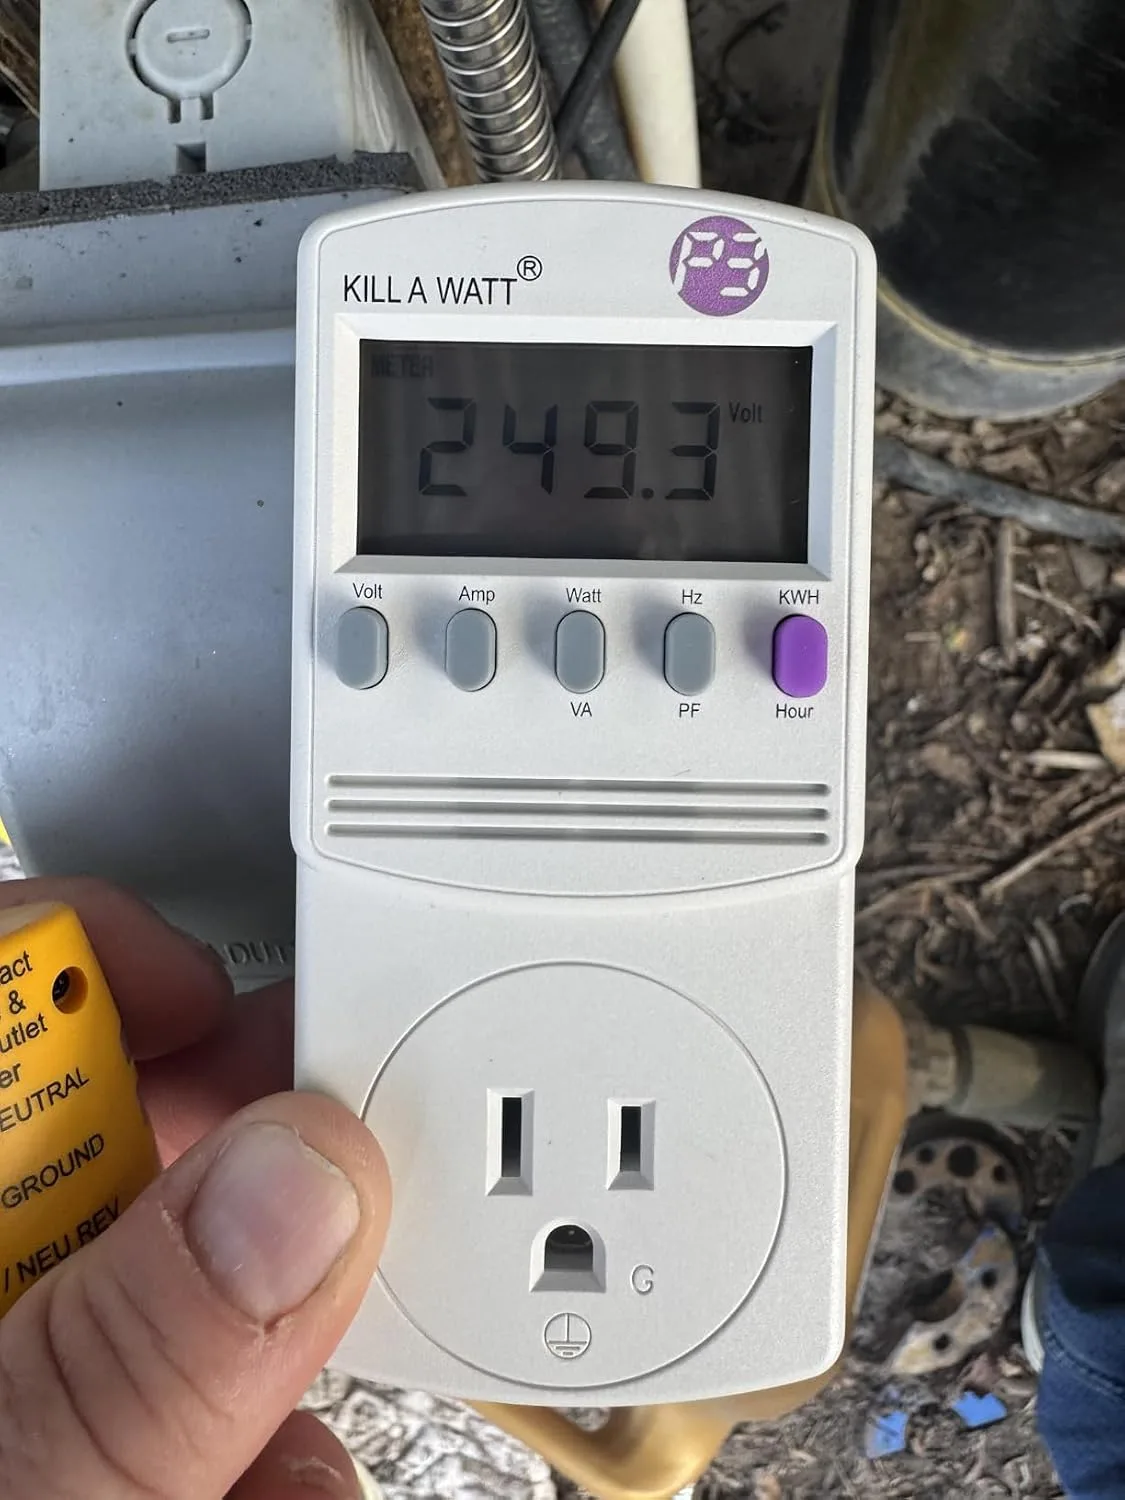
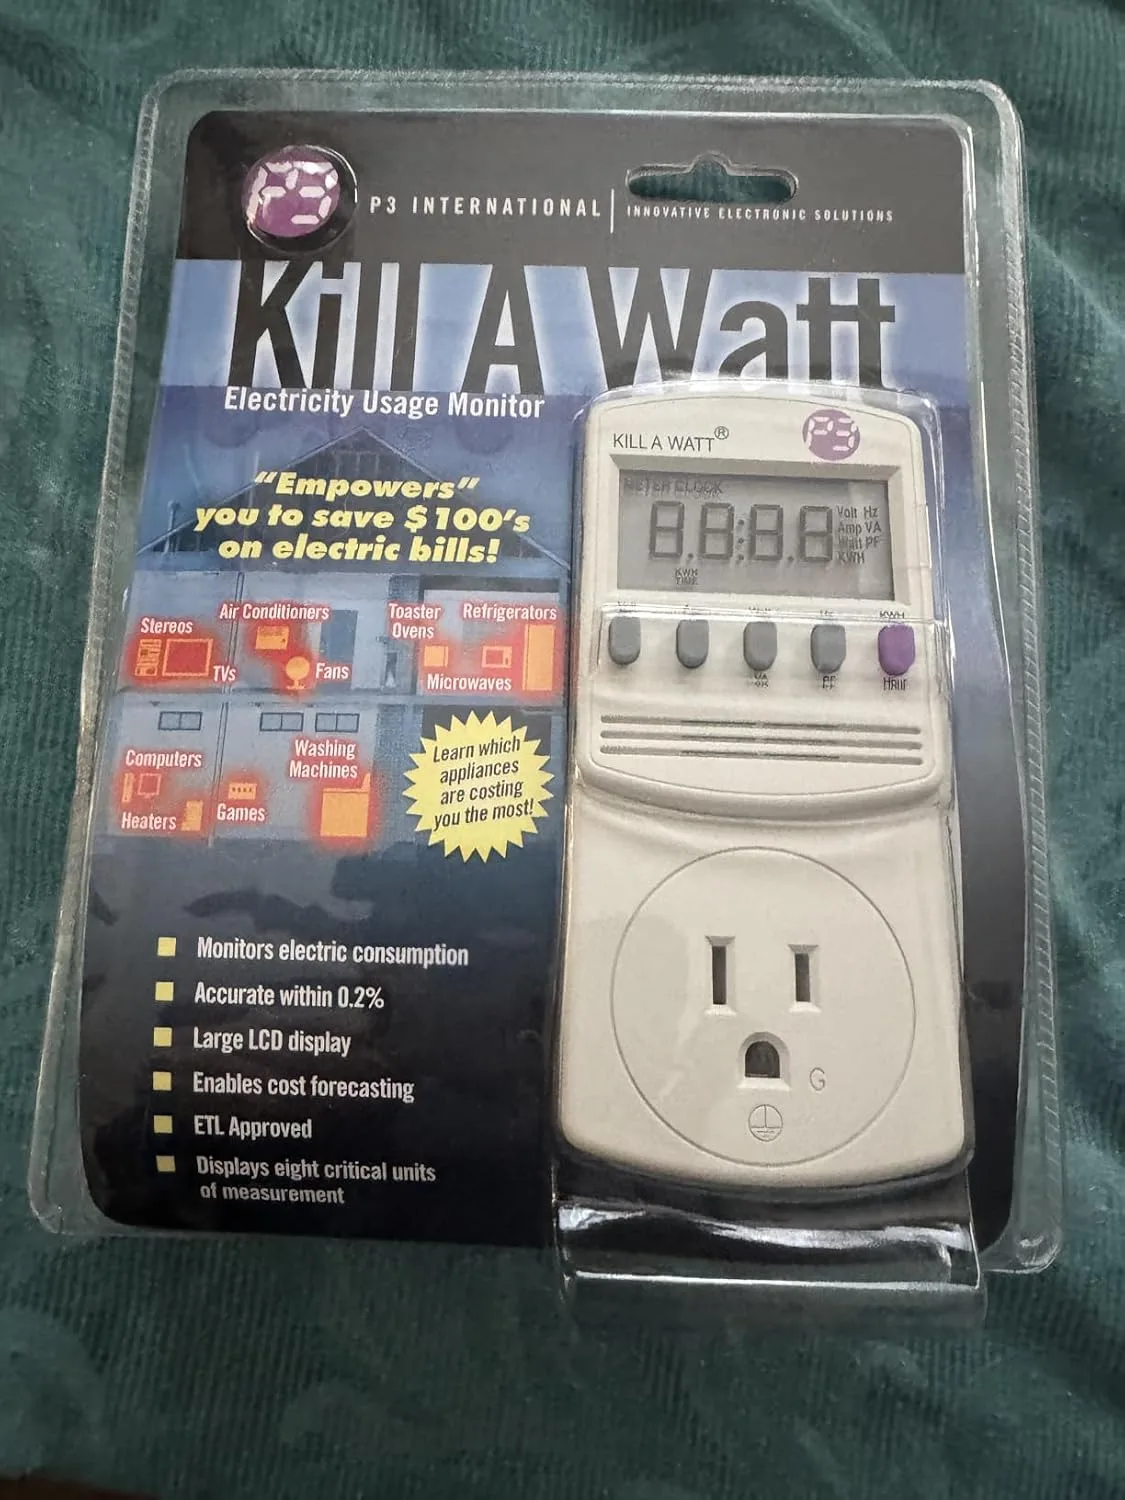
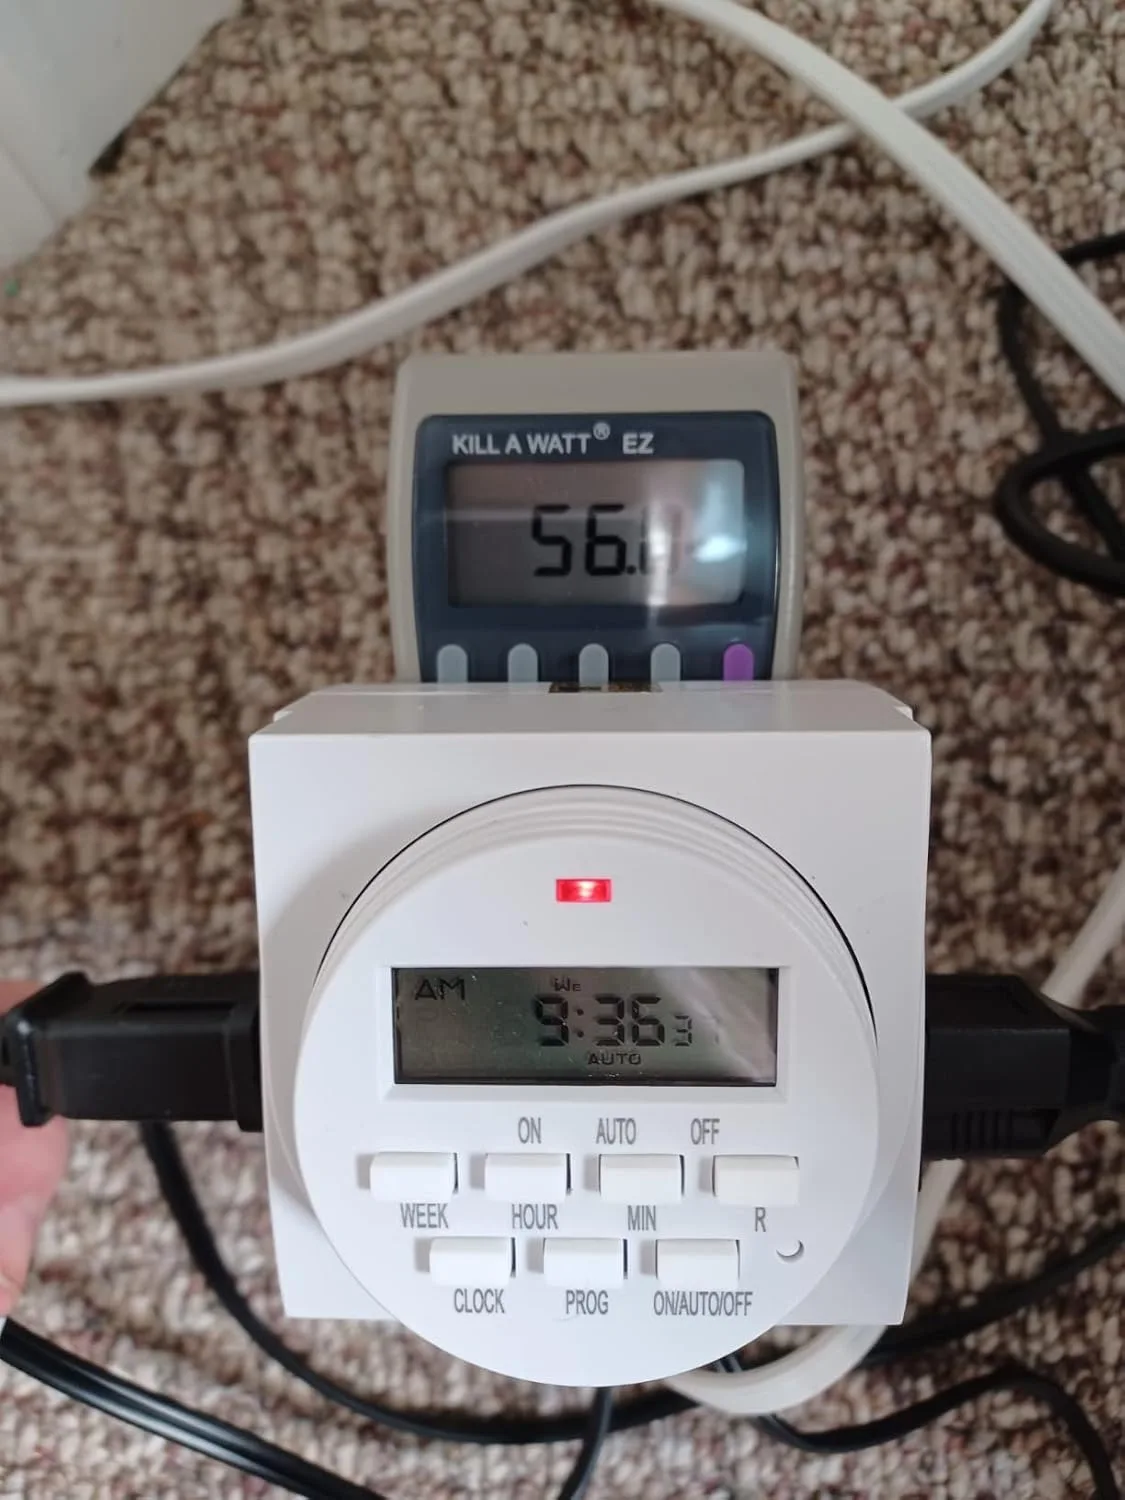
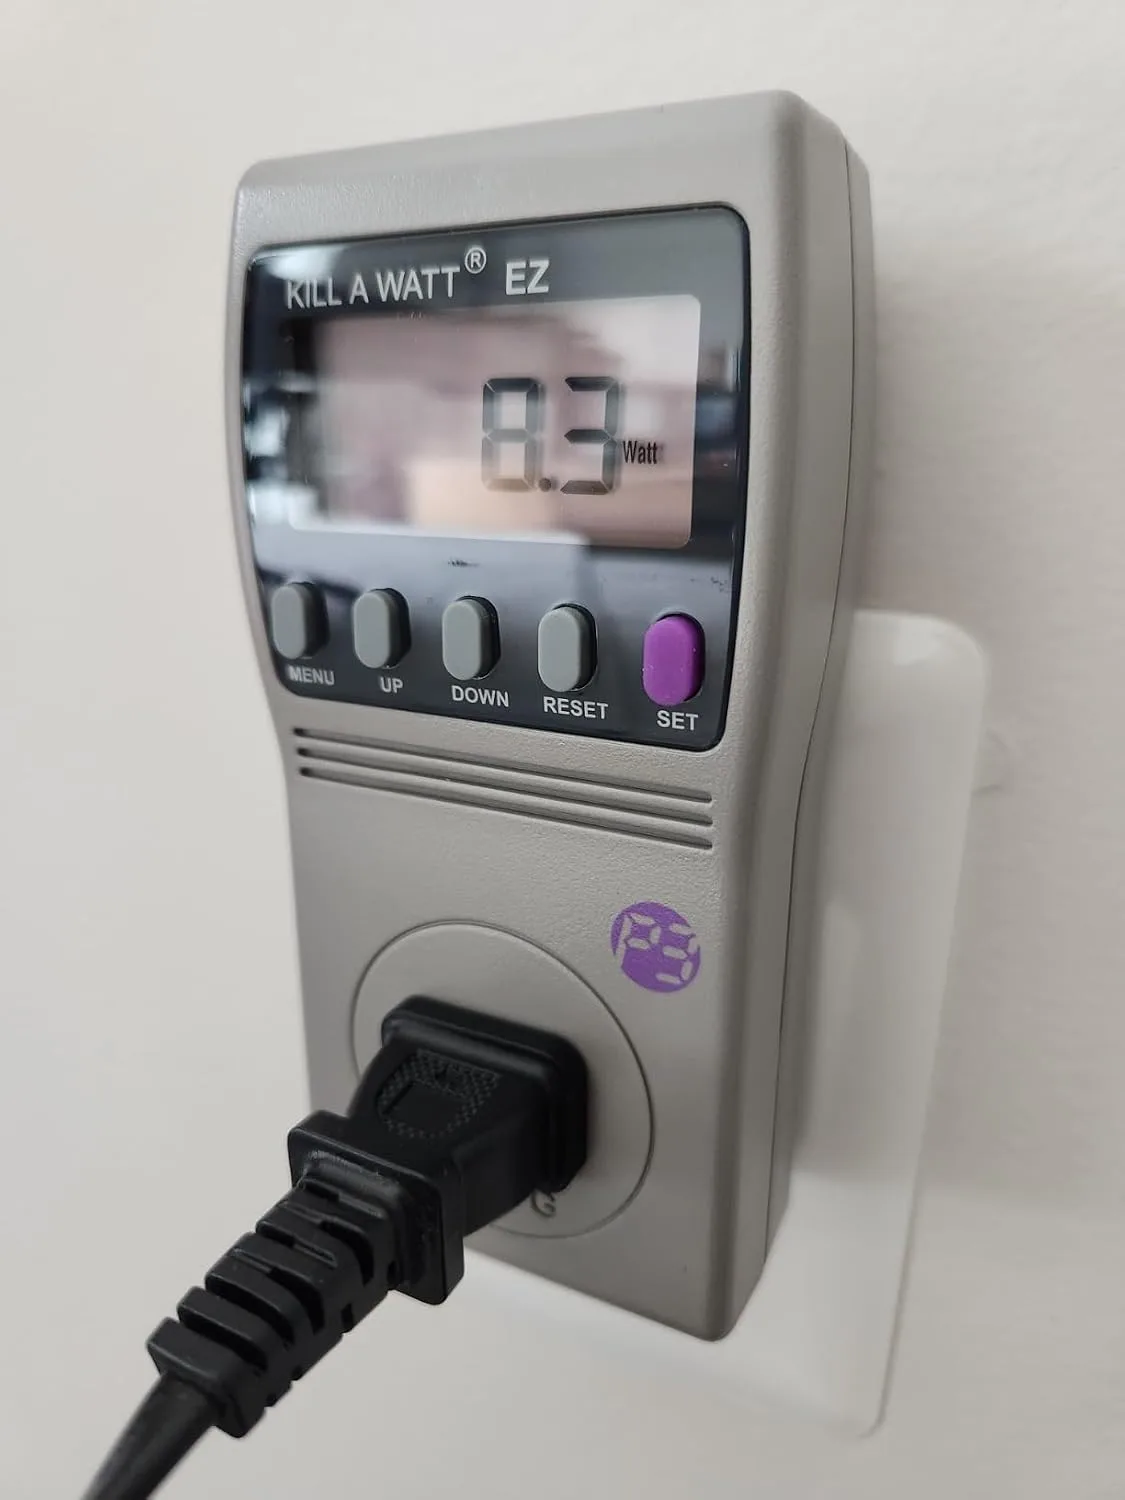
You can’t fix what you can’t measure. I spent the first week of my 30-day audit just guessing which devices were the real culprits—until I plugged in a Kill A Watt meter and actually saw the numbers.
What works
- Shows real-time wattage AND tells you exactly how much that device costs to run per month—no calculator needed.
- Catches the sneaky stuff: my cable box was pulling 28 watts 24/7, my printer another 12. The meter made it impossible to ignore.
- Simple enough that I could hand it to my wife and she’d use it without calling me for help—critical when you’re tracking 30+ devices in a month.
What doesn’t
- The display is small and honestly a little hard to read in dim light—you’ll be leaning in close to jot down numbers.
- It only works on one outlet at a time, so tracking phantom loads across your whole house means a lot of moving it around (which is why my 30 days turned into a real commitment).
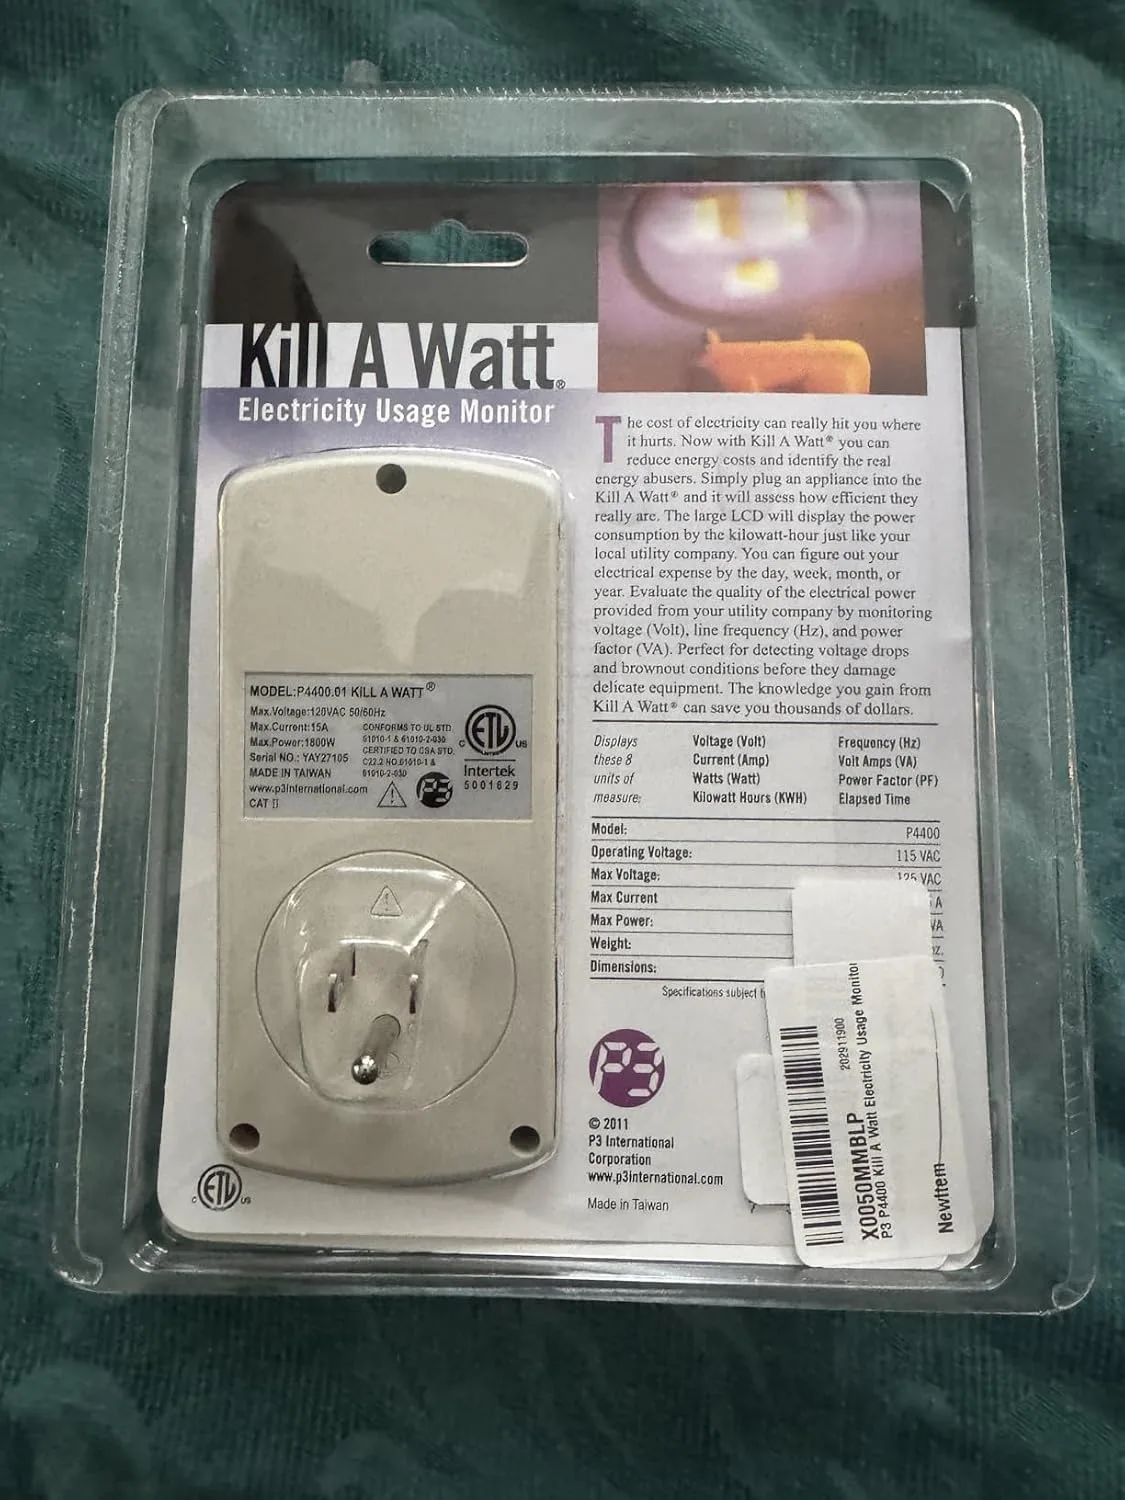
I’ll admit, halfway through my audit I almost convinced myself the data wasn’t worth the effort—until I saw that my always-on devices were costing me roughly $50 a month, which explained that mystery bill spike perfectly. If you’re serious about finding where your electricity is actually going, grab a P3 P4400 Kill A Watt Electricity Usage Monitor.
This post contains affiliate links. As an Amazon Associate, I earn from qualifying purchases at no extra cost to you.
P3 P4400 Kill A Watt Electricity Usage Monitor
I found $15+ in monthly phantom drain by plugging this in—no math required.
Check Price on Amazon →